How to Set Up Bybit Charts | Technical Indicators | Bollinger Bands | Moving Averages | MACD
In this blog post, we will explore how to set up charts on Bybit and learn about technical indicators such as Bollinger Bands, Moving Averages, and MACD. Technical analysis is crucial for success in cryptocurrency trading. Bybit offers powerful chart functions based on TradingView, allowing for professional technical analysis. However, beginners may be confused about how to set up which technical indicators. Key technical indicators like Bollinger Bands, Moving Averages, and MACD play an essential role in identifying market trends and trading signals. Properly utilizing these tools can help you make more accurate trading decisions. In this post, we will explain in detail how to set up Bybit charts, how to add key technical indicators, and how to use them.

How to Set Up Bybit Charts
It is best to get familiar with charts by using them yourself. Describing all the functions of a chart requires a whole book. We will briefly explain the necessary functions, so please refer to the post below and try it yourself.
If you don't have a Bybit account yet, please sign up through the commission discount link above before proceeding with the registration. By registering through this link, you can receive a maximum commission discount benefit for life.
The image below explains from number 1 to 5.
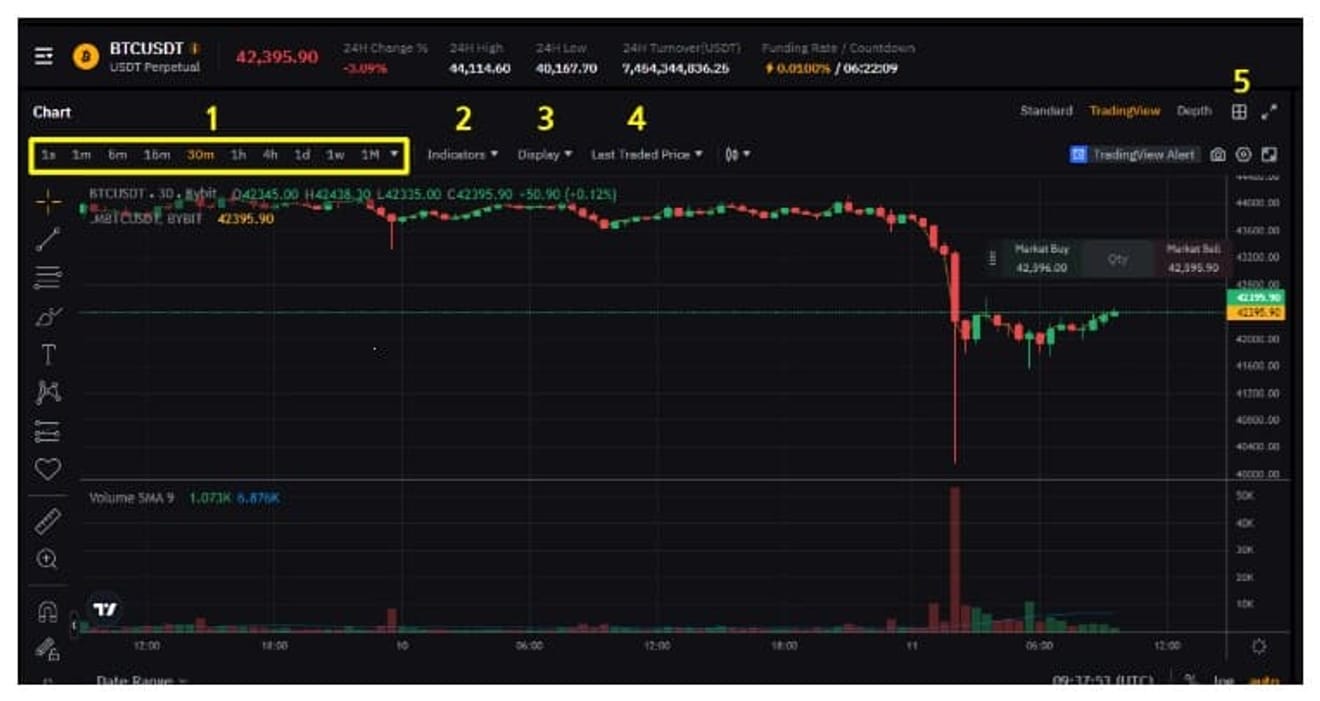
You can set the single chart candlestick unit at number 1. 1 second is displayed as 1s, 1 minute as 1m, 5 minutes as 5m, 30 minutes as 30m, 1 hour as 1h, 4 hours as 4h, 1 week as 1w, and 1 month as 1M.
You can set technical indicators at number 2. There are dozens of indicators, and we will explain the three essential indicators, Bollinger Bands, Moving Averages, and MACD, in more detail at the bottom of the post.

At number 3, you can remove or add various displays on the chart. For example, if you disable Quick Trading Features (market order), the yellow function below will disappear.

At number 4, you can set Last Traded Price and Mark Price.
Mark Price is the average market price of major exchanges such as Binance, Bybit, Bitget, and Coinbase, not Bybit's exchange price. Last Traded Price means the most recent price concluded on Bybit.
The reason Mark Price is important is that it is the basis for forced liquidation instead of Last Traded Price, so you need to pay close attention.
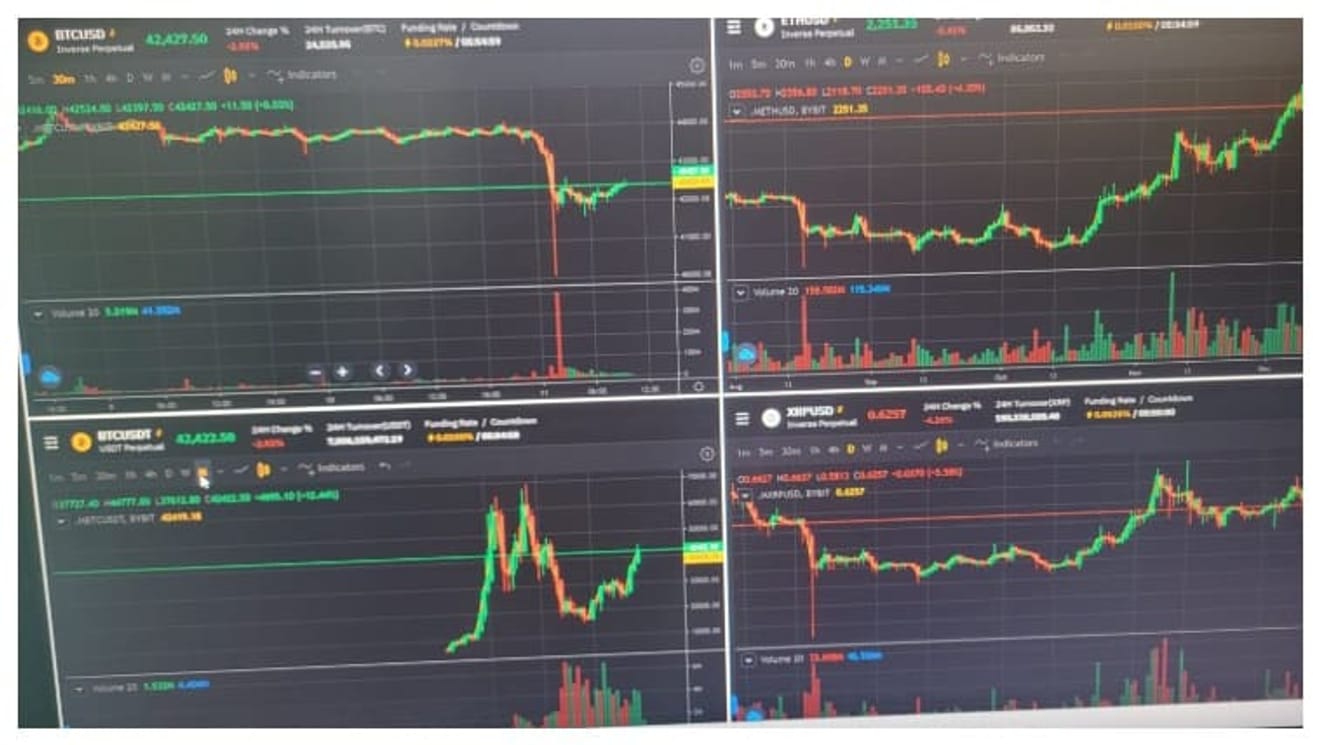
At number 5, you can view multiple charts simultaneously and set individual settings for each chart. This is an essential function for those who trade charts.
How to Set Up Bybit Technical Indicators
Now, we will explain how to set up Bollinger Bands, Moving Averages, and MACD.
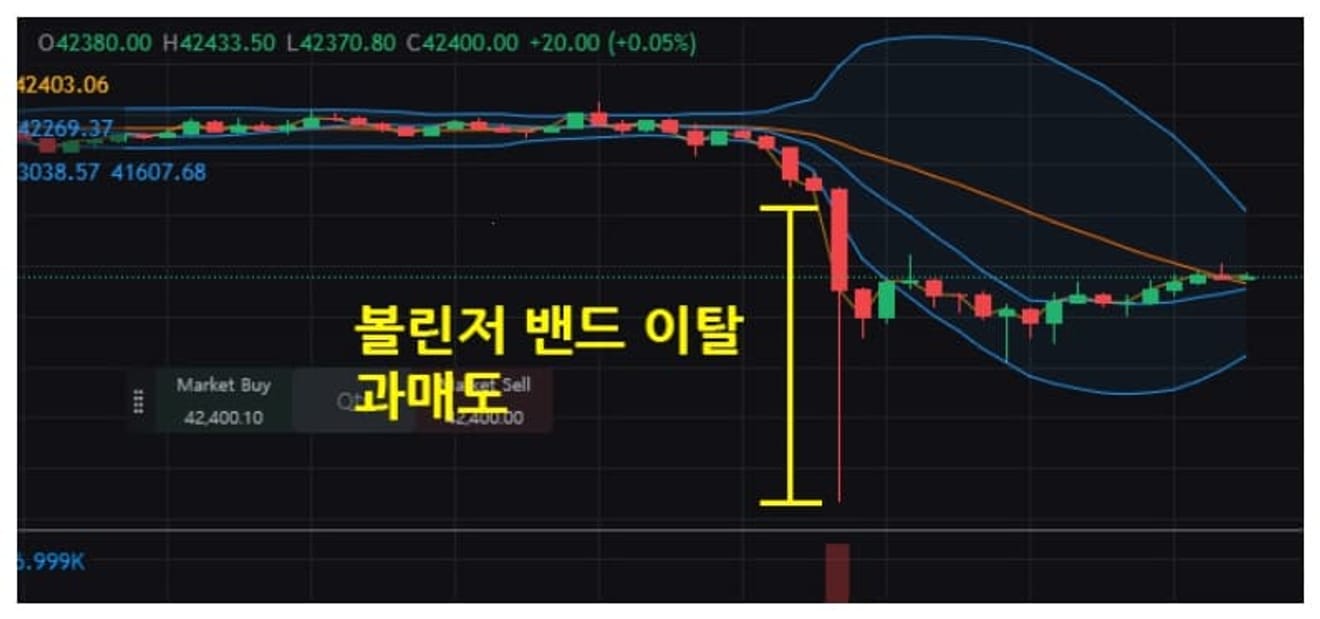
1. Bybit Bollinger Bands
Bollinger Bands is a technical indicator that measures volatility based on moving averages.

Simply put, if the band's width widens compared to before based on the coin's upper and lower limits, you can determine overbought or oversold conditions.
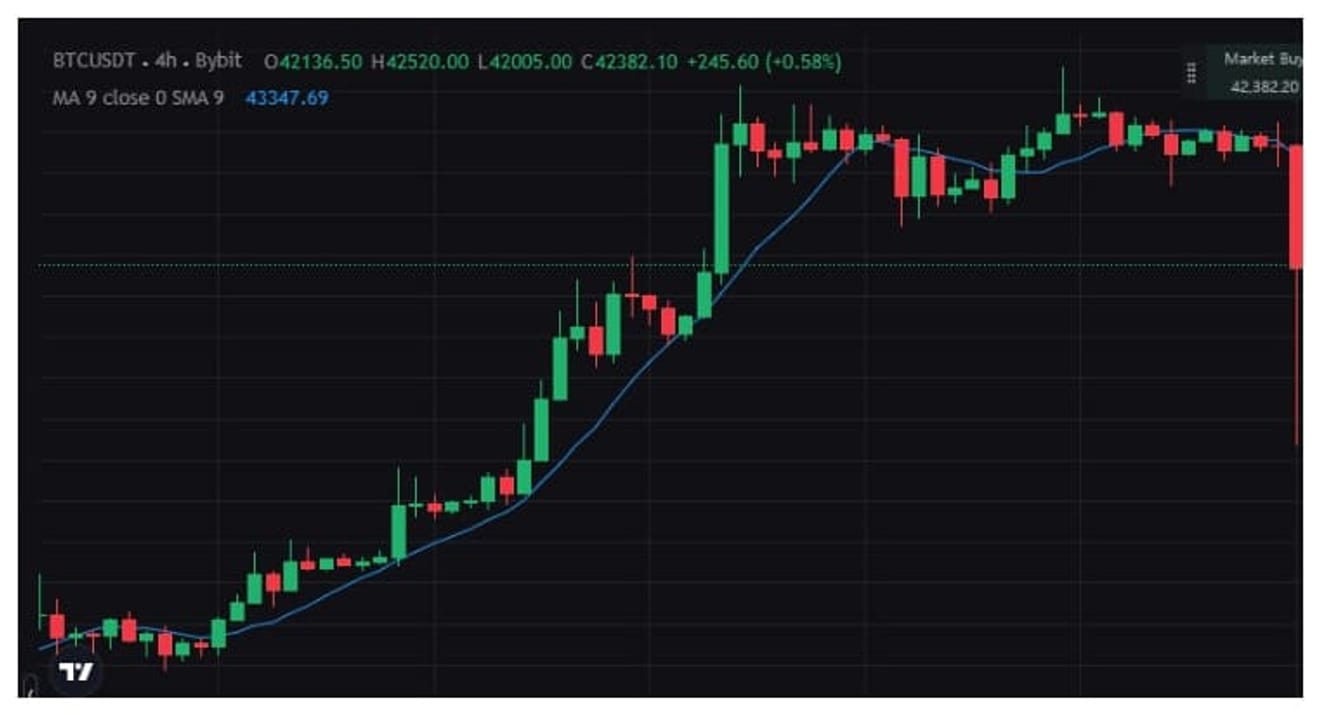
2. Bybit Moving Averages
This refers to a line that is connected by arithmetically averaging the coin price over a certain period.

We mentioned earlier that candlesticks are displayed as 1s for 1 second, 1m for 1 minute, 5m for 5 minutes, 30m for 30 minutes, 1h for 1 hour, 4h for 4 hours, 1w for 1 week, and 1M for 1 month depending on the settings. The moving average is also applied according to these settings.
3. Bybit MACD
MACD is an indicator that uses the property of long-term moving averages and short-term moving averages that diverge from each other and then converge again and intersect. The goal is to find the maximum point where the two moving averages diverge.

You probably won't have much difficulty deciding your investment direction with just the three indicators explained above.